
A 2013 paper, Spatial Distribution of U.S. Household Carbon Footprints Reveals Suburbanization Undermines Greenhouse Gas Benefits of Urban Population Density, and the associated CoolClimate map tool, present a visually striking comparison of the impacts of transportation, land use, and energy choices on carbon emissions. Findings from this study affect city strategies for climate action plans, and present an opportunity to tailor community-specific solutions by keeping smart growth tenets in mind.
Looking at 37 different variables, including population density, energy prices, and weather, the study approximated greenhouse gas emissions resulting from energy, transportation, food, goods and services consumed by average households in essentially all populated U.S. zip codes.
The study concluded that vehicle ownership, household income, and home size are the primary drivers of carbon footprint size. These variables are interlinked, as households with higher incomes tend to own larger homes, which consume more (often carbon-produced) energy to maintain, and own more cars per household. All of this is to say that the design, land use, and household characteristics associated with suburban sprawl contribute to more carbon-intensive consumption.
Population density plays a role in determining the total output of household carbon emissions, but it’s difficult to link it as a primary driver across geographies. Additionally, population density does not seem to contribute to net greenhouse gas reductions in urban cores when considering entire metropolitan areas.
Historically dense urban centers emit less carbon per household than their outlying suburbs
The study consistently found lower HCF in urban core cities and higher HCF in outlying suburbs. The density of central cities helps contribute to lower carbon footprints; while not explicitly stated, this trend may be tied to lower rates of car ownership and driving for households in city centers. Alarmingly, the study found that low-carbon central cities tend to have high carbon footprint suburbs, with larger, more population-dense metropolitan areas having slightly higher HCF.

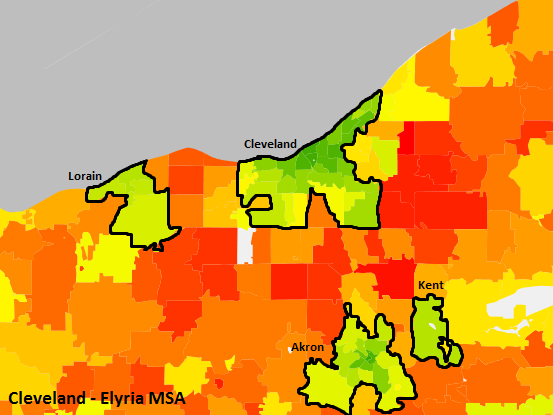
You can see this clearly in places like the Metro-Atlanta area. The Atlanta City center is a pocket of low-carbon emitting households (between 25-47 metric tons of CO2 per zip code) surrounded by a ring of high-carbon emitting suburbs (between 50-76 metric tons of CO2 per zip code). Cities across Ohio exhibit the same trend; looking at Akron, Cleveland and Columbus, the city centers and suburban communities are distinct based on their measures of carbon emissions.
Findings from the study have big implications on urban planning, specifically as it relates to emission reduction goals. Cities and counties should shift their focus to community-wide strategies to reduce emissions, rather than focusing specifically within their jurisdictions. Finally, development patterns and design need to be conscious of their impacts on household emissions, particularly as they relate to transportation.

Outlined area captures 23 zip codes within Columbus municipal boundaries
While the study doesn’t explicitly address Smart Growth strategies, there is a clear opportunity for their use in reducing household emissions. Smart Growth objectives to increase access to public transit, create more vibrant, walkable areas, increase multi-modal transportation, and encourage the colocation of residential and commercial land uses can fit into tailored solutions for cities and counties.
To read the full paper, create an ACS account and then click here to download.